Theories of change and logic models
Readings
- Chapter 2 in Impact Evaluation in Practice (Gertler et al. 2016)
- Chapter 2 in Evaluation: A Systematic Approach (Rossi, Lipsey, and Henry 2019). This is available on iCollege.
- Chapter 3 in Evaluation: A Systematic Approach (Rossi, Lipsey, and Henry 2019). This is available on iCollege.
Slides
The slides for today’s lesson are available online as an HTML file. Use the buttons below to open the slides either as an interactive website or as a static PDF (for printing or storing for later). You can also click in the slides below and navigate through them with your left and right arrow keys.
Tip
Fun fact: If you type ? (or shift + /) while going through the slides, you can see a list of special slide-specific commands.
Videos
Videos for each section of the lecture are available at this YouTube playlist.
You can also watch the playlist (and skip around to different sections) here:
In-class stuff
Here are all the materials we’ll use in class:
- Session 3 FAQ slides (PDF)
- Main Quarto documentation
- IRL Quarto examples:
- {modelsummary} documentation
Hands-on R materials:
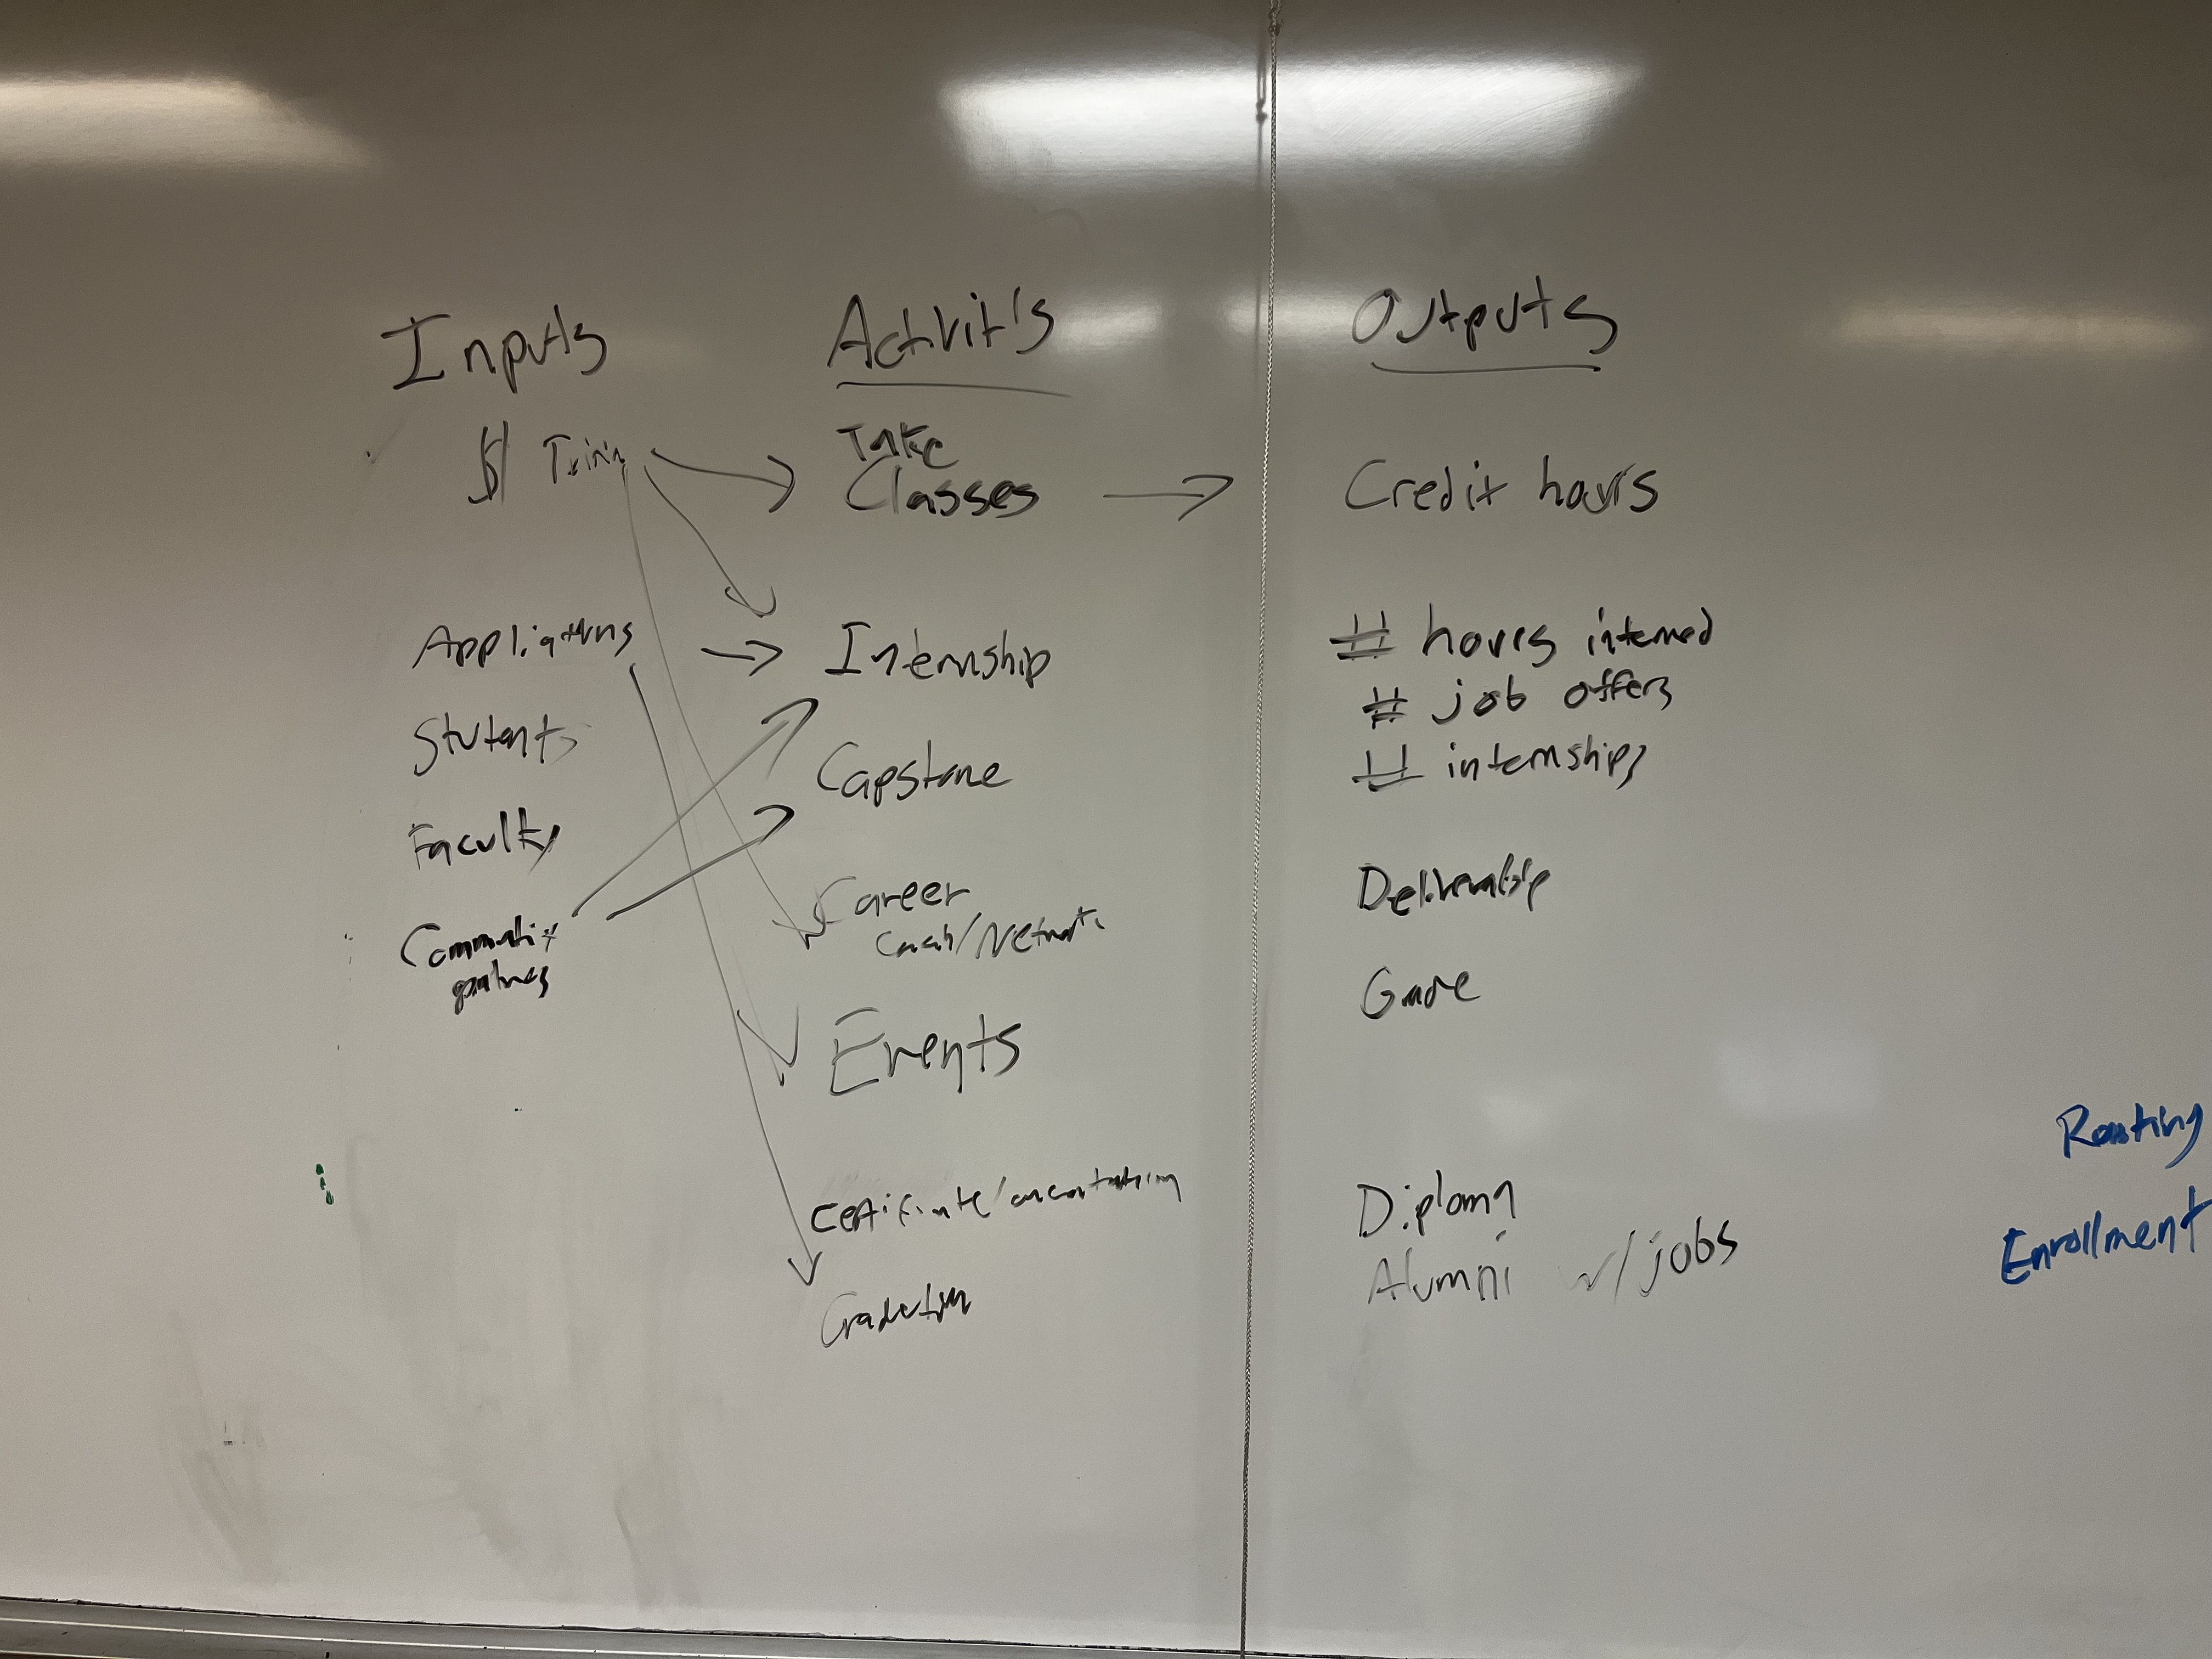
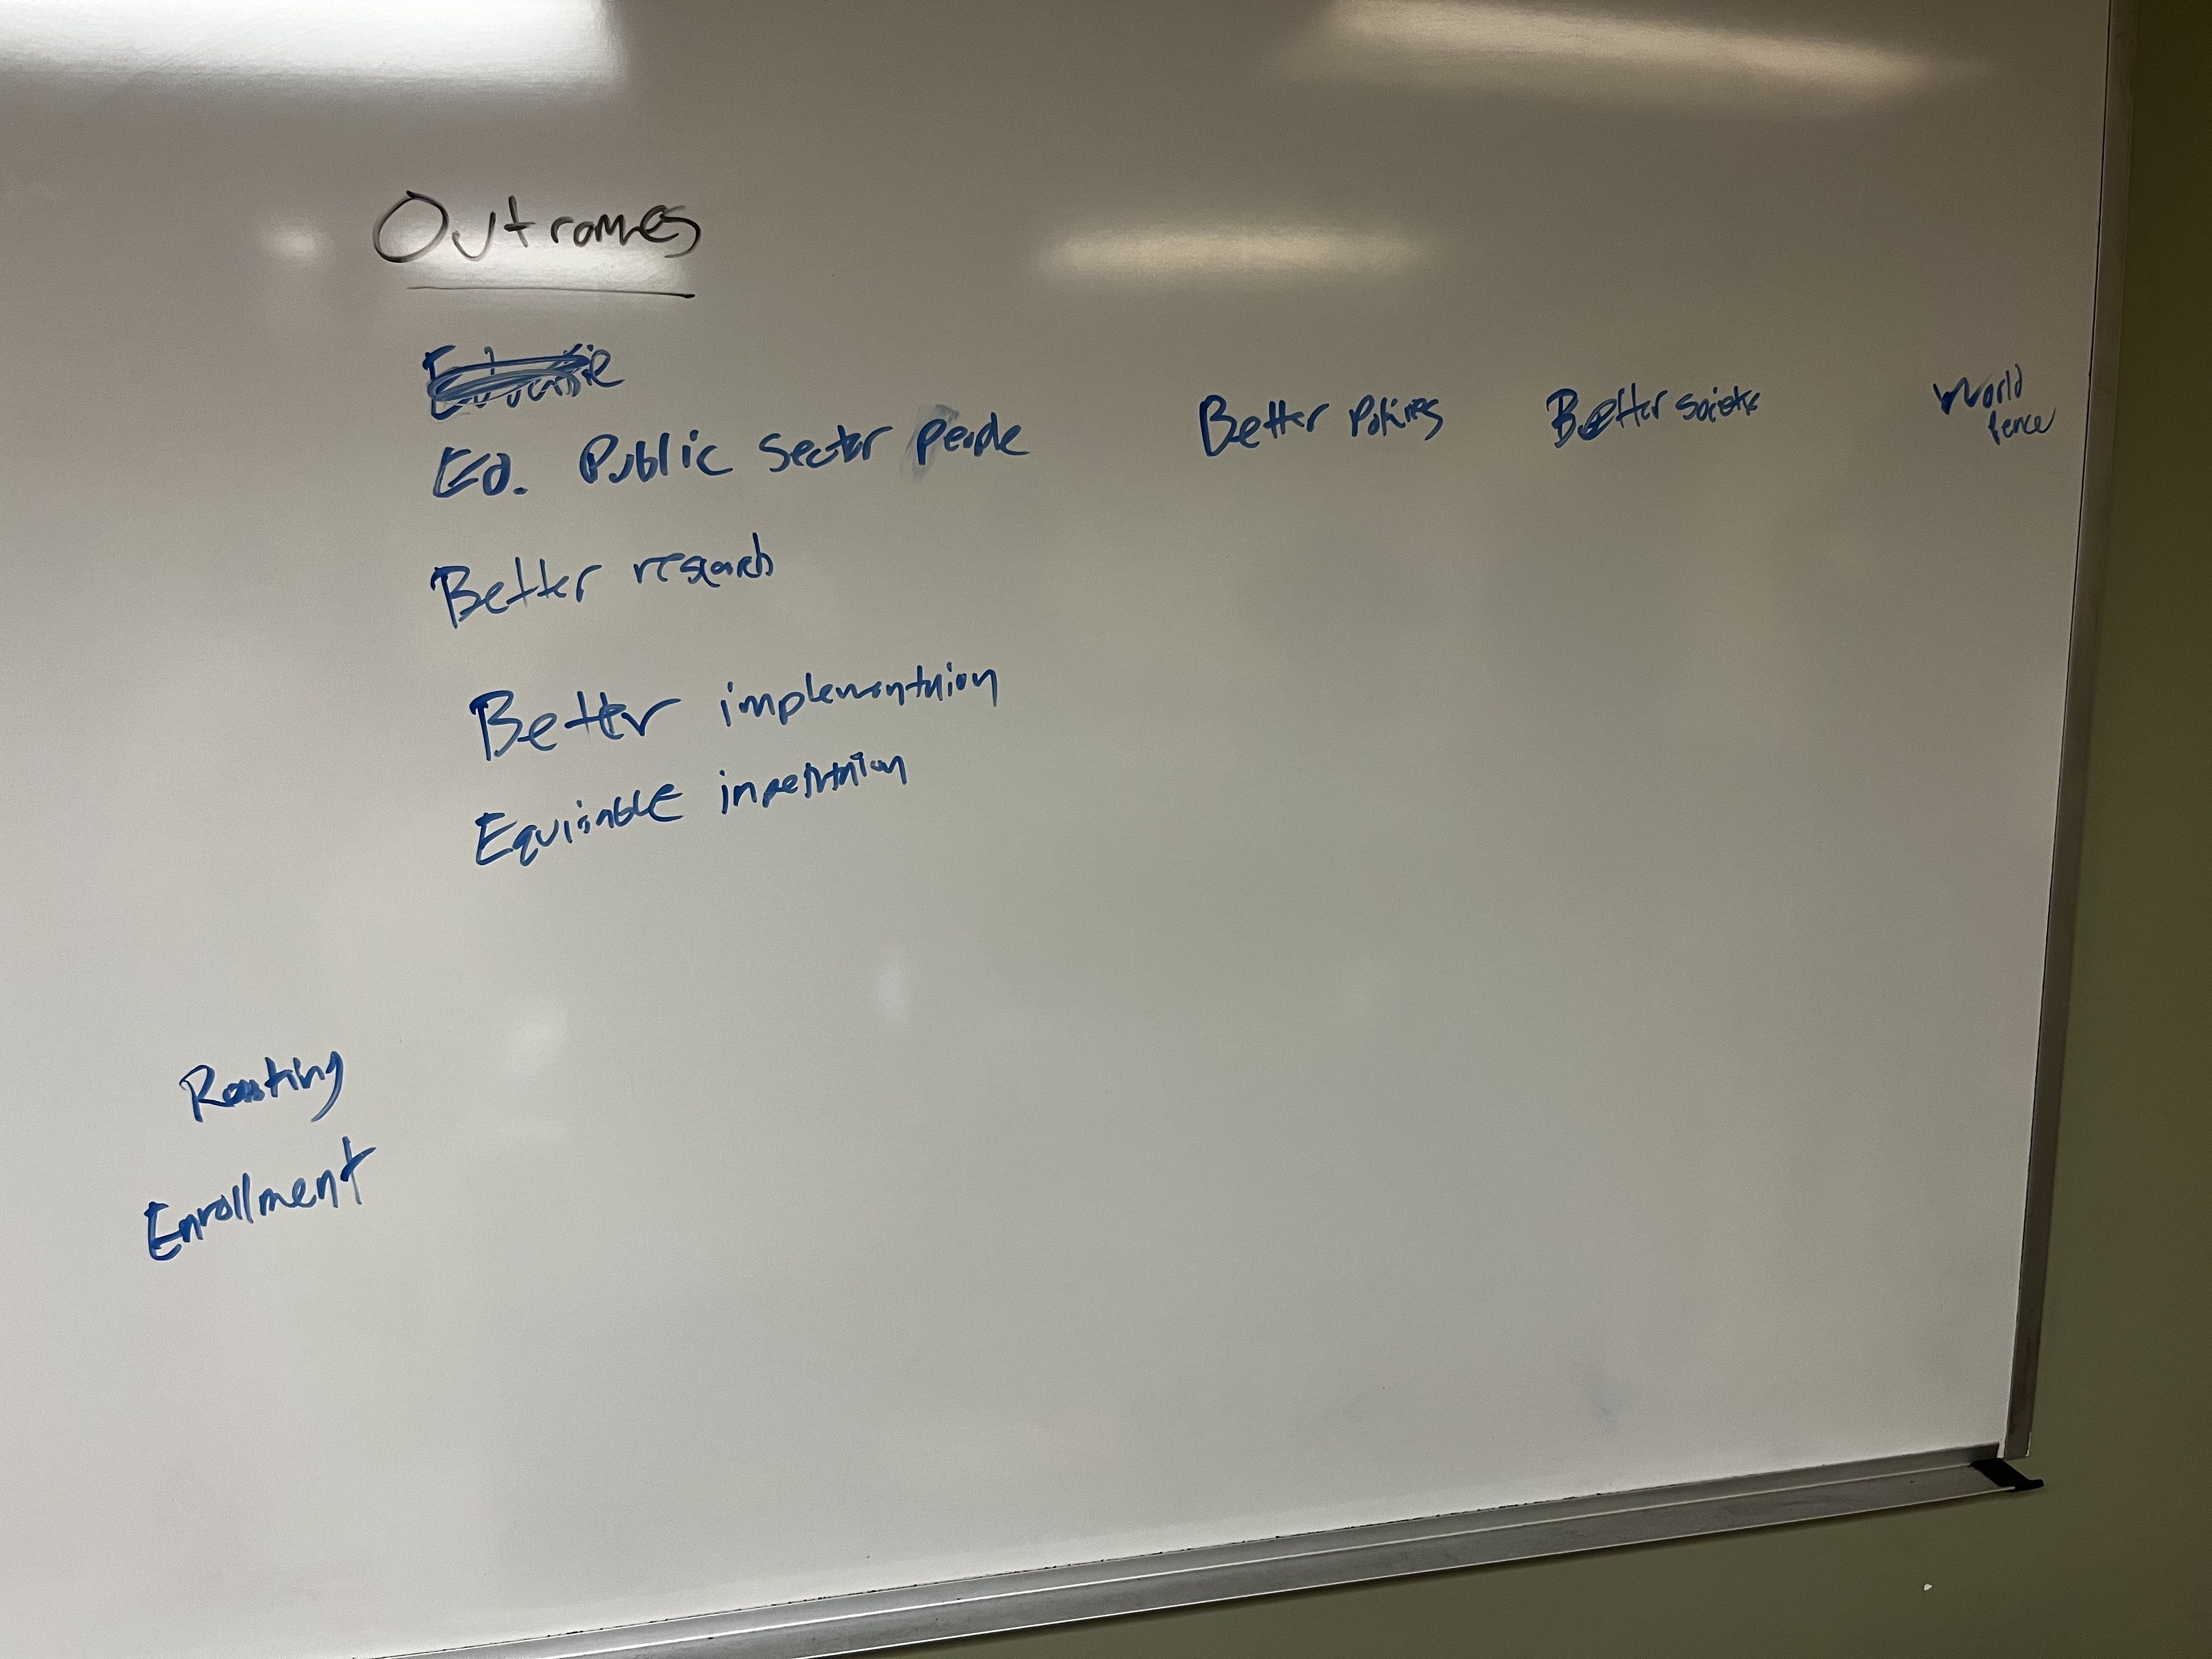
Logic model for MPA/MPP program
Translation into actually legible text, since the diagram in the photos (included below!) was written in my atrocious handwriting.
This uses ggplot, since lots of you asked if it’s possible to do this with R (it is! it’s just a little tedious, as you can see by the length of this code). It’s also possible to do this with free online diagramming software.
Show this long, complex code
library(tidyverse)
library(tidygraph)
library(ggraph)

clrs <- viridisLite::viridis(8, option = "inferno", begin = 0.1, end = 0.9)

nodes <- tribble(
  ~id , ~x , ~y , ~item                                      ,
    1 ,  1 ,  1 , "Tuition money"                            ,
    2 ,  1 ,  2 , "Applications"                             ,
    3 ,  1 ,  3 , "Students"                                 ,
    4 ,  1 ,  4 , "Faculty"                                  ,
    5 ,  1 ,  5 , "Community partners"                       ,

    6 ,  2 ,  1 , "Take classes"                             ,
    7 ,  2 ,  2 , "Internship"                               ,
    8 ,  2 ,  3 , "Capstone"                                 ,
    9 ,  2 ,  4 , "Career coaching/\nnetworking"             ,
   10 ,  2 ,  5 , "Events"                                   ,
   11 ,  2 ,  6 , "Certificate programs"                     ,
   12 ,  2 ,  7 , "Graduation"                               ,

   13 ,  3 ,  1 , "# of credit hours"                        ,
   14 ,  3 ,  2 , "# of hours in internship"                 ,
   15 ,  3 ,  3 , "# of job offers"                          ,
   16 ,  3 ,  4 , "Deliverable for client"                   ,
   17 ,  3 ,  5 , "Grade"                                    ,
   18 ,  3 ,  6 , "Diploma"                                  ,
   19 ,  3 ,  7 , "# of alumni with jobs"                    ,

   20 ,  5 ,  1 , "Better educated\npublic sector workforce" ,
   21 ,  5 ,  2 , "Better research\nabout the public sector" ,
   22 ,  5 ,  3 , "Better implementation\nof policy"         ,
   23 ,  5 ,  4 , "More equitable\nimplementation of policy" ,
   24 ,  6 ,  1 , "Better policies"                          ,
   25 ,  6 ,  2 , "Better society"                           ,
   26 ,  7 ,  1 , "World peace!"                             ,
   27 ,  4 ,  1 , "GSU/AYS ranking"                          ,
   28 ,  4 ,  2 , "Overall\nGSU enrollment"
)

inputs_from <- c(1, 1, 1, 1, 1, 1, 1, 2, 3, 4, 3, 3, 4, 5, 5, 3, 4, 3)
inputs_to <- c(6, 7, 8, 9, 10, 11, 12, 6, 6, 6, 7, 8, 8, 7, 9, 12, 12, 10)

activities_from <- c(6, 6, 6, 6, 7, 7, 7)
activities_to <- c(13, 17, 18, 19, 14, 15, 16)

edges <- tibble(
  from = c(inputs_from, activities_from),
  to = c(inputs_to, activities_to)
)

stages <- tribble(
  ~stage       , ~label                           , ~x ,
  "Inputs"     , "Recipient government\naction"   ,  1 ,
  "Activities" , "Donor government\nresponse"     ,  2 ,
  "Outputs"    , "Recipient government\nresponse" ,  3 ,
  "Outcomes"   , "Recipient government\nresponse" ,  4
) |>
  mutate(
    xmin = x - 0.5,
    xmax = x + 0.5
  ) |>
  mutate(
    x = ifelse(stage == "Outcomes", 5.5, x),
    xmax = ifelse(stage == "Outcomes", xmax + 3, xmax)
  )

tidy_graph <- tbl_graph(nodes = nodes, edges = edges) |>
  create_layout(layout = nodes)

ggraph(tidy_graph) +
  geom_rect(
    data = stages,
    aes(xmin = xmin, xmax = xmax, ymin = 0.5, ymax = Inf, fill = stage),
    inherit.aes = FALSE,
    alpha = 0.25
  ) +
  geom_rect(
    data = stages,
    aes(xmin = xmin, xmax = xmax, ymin = -Inf, ymax = 0.5, fill = stage),
    inherit.aes = FALSE,
    alpha = 0.5
  ) +
  geom_text(
    data = stages,
    aes(x = x, y = 0.2, label = stage),
    inherit.aes = FALSE,
    size = 3.5,
    fontface = "bold",
    lineheight = 1
  ) +
  geom_edge_link(
    aes(
      start_cap = label_rect(node1.item, padding = margin(5, 5, 5, 5, "pt")),
      end_cap = label_rect(node2.item, padding = margin(5, 5, 5, 5, "pt"))
    ),
    arrow = arrow(angle = 30, length = unit(6, "pt"), type = "closed"),
    edge_linewidth = 0.25,
    color = "grey40"
  ) +
  geom_node_label(
    aes(x = x, y = y, label = item),
    label.r = unit(0, units = "pt"),
    size = 3.5,
    lineheight = 1,
    fontface = "bold",
    fill = "white"
  ) +
  annotate(
    geom = "text",
    x = I(0.99),
    y = I(0.1),
    label = "Important—we gave up on drawing every\nsingle arrow, so this is definitely incomplete!",
    hjust = 1,
    fontface = "bold.italic"
  ) +
  scale_x_continuous(expand = expansion(0)) +
  scale_y_reverse() +
  scale_fill_manual(
    values = c(clrs[3], clrs[1], clrs[6], clrs[5]),
    guide = "none"
  ) +
  expand_limits(y = 0.9) +
  theme_void()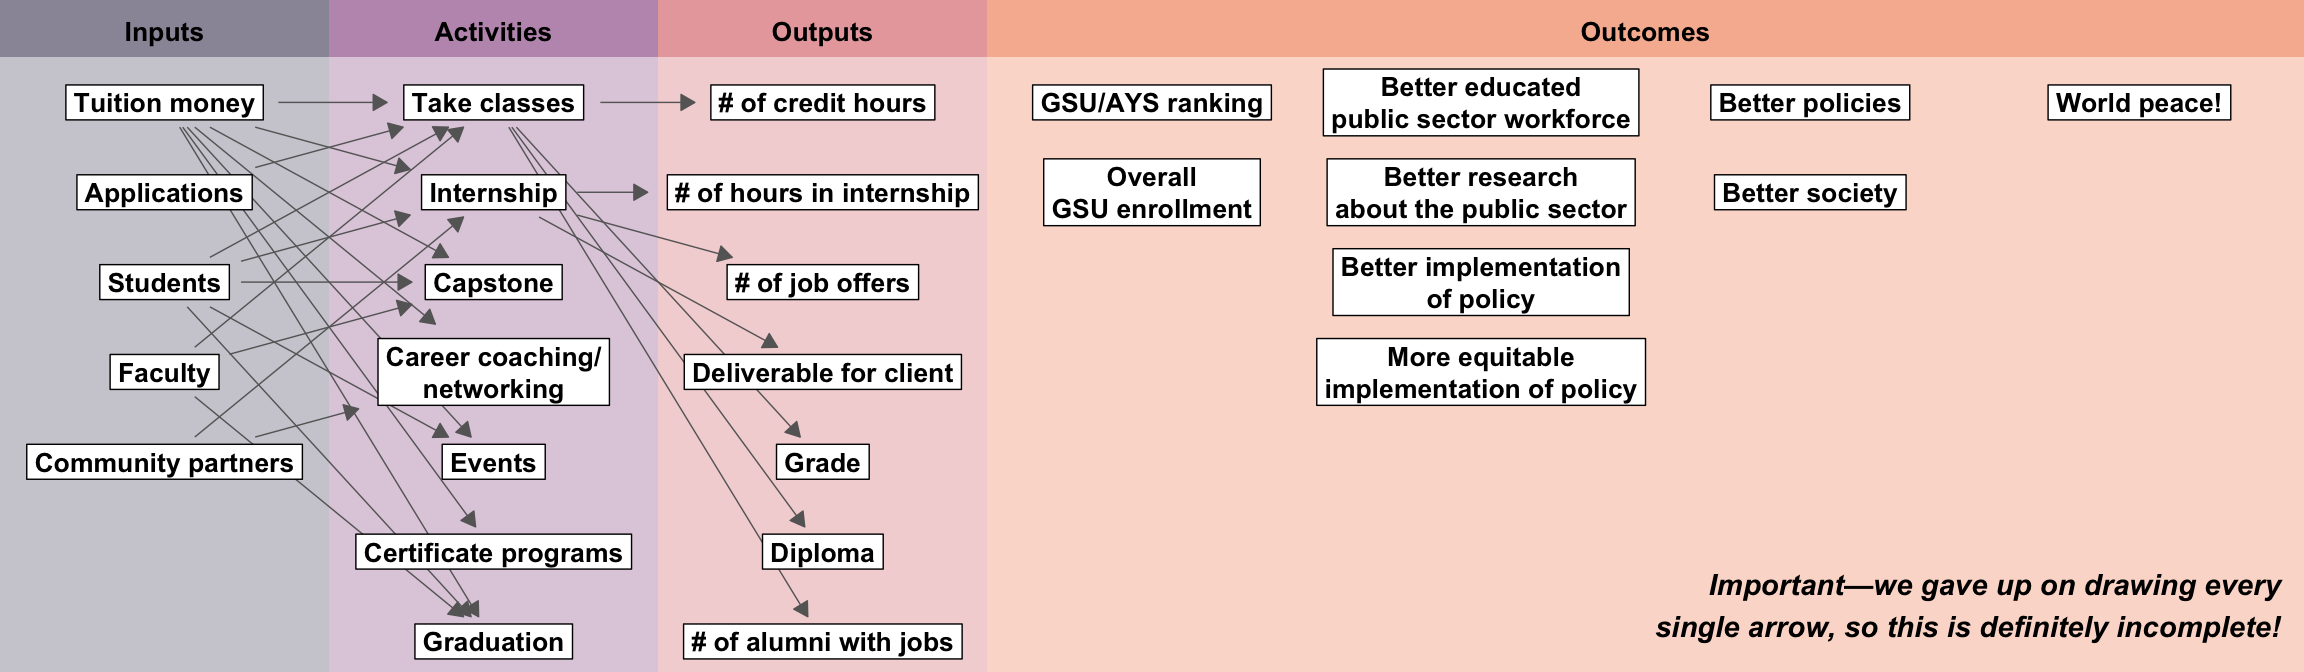
References
Gertler, Paul J., Sebastian Martinez, Patrick Premand, Laura B. Rawlings, and Christel M. J. Vermeersch. 2016. Impact Evaluation in Practice. 2nd ed. Washington, DC: Inter-American Development Bank and World Bank. https://doi.org/10.1596/978-1-4648-0779-4.
Rossi, Peter H., Mark W. Lipsey, and Gary T. Henry. 2019. Evaluation: A Systematic Approach. 8th ed. Los Angeles: SAGE.